Financial management
The value of a company is the key quantity in all financial management, and it is determined chiefly by three things: (1) the size of the free cash flow (FCF) the company generates, together with (2) its timing and (3) the risk attached to that cash flow.
All else being equal, risk and the cost of capital move together; risk and return are covered in more detail in part 4. The weighted average cost of capital (WACC) is the average required return that all investors demand of a company. The value of a company can be described with the following equation:
Free cash flow (FCF) is covered in more detail in part 6, the weighted average cost of capital (WACC) in part 8, and company valuation in part 9.
Interest
Interest is the fee a borrower pays for the use of capital over a given period, which makes it a time-related cost. In almost all cases interest is quoted on an annual basis and as a percentage of the principal of the loan. Interest comes in two forms: (1) simple interest and (2) compound interest, the difference being whether interest is calculated on previously accrued interest or not.
Simple interest
When interest is calculated on the principal alone, it is called simple interest.
- P = principal at start of period
- i = nominal interest rate
- n = time (in years)
Example 2-1
Gunnar buys a bond with a face value of ISK 100,000 carrying 6% nominal interest, maturing in six months. What will the interest payment be, and how much does he get back?
Compound interest
When interest is calculated on the principal together with previously accrued interest, it is called compound interest.
- P = principal at start of period
- i = nominal interest rate
- n = time (in years)
Example 2-2
Jón buys a bond with a face value of ISK 100,000 carrying 6% nominal interest, maturing in three years. What will the interest payment be, and how much does he get back?
The example with Jón assumes that the 6% nominal interest compounds annually, which is the convention unless stated otherwise. But since compound interest accrues on both the principal and previously accrued interest, how often it is calculated within each period matters a great deal. Compound interest therefore falls into three types: (1) annual compounding, as in example 2–2 above, (2) periodic compounding, and (3) continuous compounding.
Periodic compounding
When compound interest is calculated more than once a year, it is called periodic compounding. The number of compounding periods says how often interest is calculated per year.
- P = principal at start of period
- i = nominal interest rate
- n = time (in years)
- m = number of compounding periods per year
Example 2-3
Einar deposits ISK 100,000 in a savings account paying 4% nominal interest, compounded semi-annually. How much interest does Einar earn after one year, and what is the balance?
Continuous compounding
Had the 4% nominal interest on Einar's account compounded annually, he would only have earned 100,000 · ((1+0.04) – 1) = ISK 4,000 in interest by the end of the year. He therefore gets ISK 40 extra because the interest compounds semi-annually, that is twice a year. Had it compounded quarterly, four times a year, he would have got ISK 60 extra, and had it compounded monthly, twelve times a year, he would have got ISK 74 extra. It is tempting to conclude from this that the more often interest is compounded in a year, the larger the interest payment becomes. The mathematician Leonhard Euler made the remarkable discovery that this is not so. He showed that , and today this important number is generally called Euler's number. Euler's discovery shows us that if the nominal interest on Einar's account had compounded infinitely often per year, that is compounded continuously, he would have got ISK 81 extra. This is set out more fully in example 2–4. Interest of this kind is called continuously compounded interest, and Euler's number is used to calculate it.
- P = principal at start of period
- i = nominal interest rate
- n = time (in years)
- e = 2.71828...
Example 2-4
Magnús deposits ISK 100,000 in a savings account paying 4% nominal interest, compounded continuously. How much interest does Magnús earn after one year, and what is the balance?
Effective annual rate
Magnús clearly gets better terms from his bank than Einar does, yet both receive 4% nominal interest. To compare investments with different numbers of compounding periods, their nominal rates are restated as though they were compounded annually. The restated rate is called the effective annual rate. To convert periodic rates into an effective annual rate, use the following equation:
- i = nominal interest rate
- m = number of compounding periods per year
To convert continuously compounded interest into an effective annual rate:
- i = nominal interest rate
Example 2-5
Compare the effective annual rate available to Einar in example 2–3 with the one available to Magnús in example 2–4.
In Microsoft ® Excel
The EFFECT function returns the effective annual rate given a nominal rate and a number of compounding periods. The NOMINAL function returns the nominal rate given an effective annual rate and a number of compounding periods.
Real interest rate
The nominal interest rate means interest calculated without regard to the price level, whereas the real interest rate means interest in excess of the change in prices over the same period. The real rate is therefore positive when the nominal rate is higher than inflation over a given period. The real rate can be derived from Fisher's equation as follows:
- i = nominal interest rate
- π = inflation
Market interest rates
The market interest rate on any debt security is built up from the real rate on government securities plus the various kinds of risk premium.
- r* = real risk-free rate of interest
- IP = inflation premium
- r* + IP = rRF = quoted risk-free rate of interest on treasury bills
- DRP = default risk premium
- LP = liquidity/marketability premium
- MRP = maturity risk premium
Time value of money
The value of any investment rests so heavily on the timing of its cash flows that few areas of finance matter more than the time value of money.
The timeline
The most important aid in time-value-of-money calculations is the timeline.

Time 0 here means today. Time 1 means the point one period from now (or the end of period 1). Time 2 means two periods from now, and time 3 three periods from now. Interest over periods 1 to 3 is taken to be 5%. Present value (PV) always sits at time 0, whereas future value (FV) can sit at the end of any period and is often written FVn, where n is the period in question.
Future value
Compounding is the operation of calculating a future value (FVn) from a given present value (PV) and a given interest rate. The future value (FVn) of a single payment is:
- FVn = future value at period n
- PV = present value
- i = interest rate
- n = number of periods
Example 3-1
Gunnar plans to invest ISK 100,000 for two years. He requires a 5% return per year. How much does he have after two years?
Present value
Discounting is the operation of calculating a present value (PV) from a given future value (FVn) and a given opportunity cost rate, which is the rate on the best available alternative investment carrying the same risk. The present value (PV) of a single payment is:
- FVn = future value at period n
- PV = present value
- i = opportunity cost rate
- n = number of periods
Example 3-2
Magnús has to pay ISK 100,000 in two and a half years. If the market rate over that period is 5%, how much does he need to set aside today to cover the payment?
Annuities
An annuity is a series of equal payments made at regular intervals over a given period. An ordinary annuity pays at the end of each period, whereas an annuity due pays at the start of each period. A perpetuity is a stream of equal payments expected to continue forever.
Future value of an annuity:
- FVAn = future value of an annuity over n periods
- PMT = the periodic payment
- i = interest rate
- n = number of periods
Present value of an annuity:
- PVAn = present value of an annuity over n periods
- PMT = the periodic payment
- i = interest rate
- n = number of periods
Present value of a perpetuity:
- PVP = present value of a perpetuity
- PMT = the periodic payment
- i = interest rate
In Microsoft ® Excel
The quantities used in time-value-of-money calculations can be worked out with the following functions:
- NPER (= n) returns the number of periods.
- RATE (= i) returns the periodic interest rate.
- PV returns the present value of the payments.
- PMT returns the periodic payment.
- FV returns the future value.
In each of these five functions, the values of the other four can be supplied as arguments.
Risk and return
Harry Markowitz described the relationship between risk and return in his 1952 paper Portfolio Selection, and has since often been called the father of modern portfolio theory (MPT). In it he set out how risk in a portfolio could be seen as volatility of returns, and measured by the standard deviation of the portfolio's return.
Risk in securities
The risk of a single security can be split into two parts: (1) market risk and (2) company-specific risk. Investors can protect themselves against company-specific risk by choosing and investing in a well-diversified portfolio. Portfolio risk (σp) therefore falls as the number of well-diversified securities in the portfolio rises, converging on the average risk in the market, that is market risk (σM), as shown in figure 4–1.
When a single security is added to a well-diversified portfolio, only that security's market risk affects the portfolio. The market risk of a security can be measured by its beta coefficient (b), which shows how much the price of a security moves relative to the swings in the market as a whole.
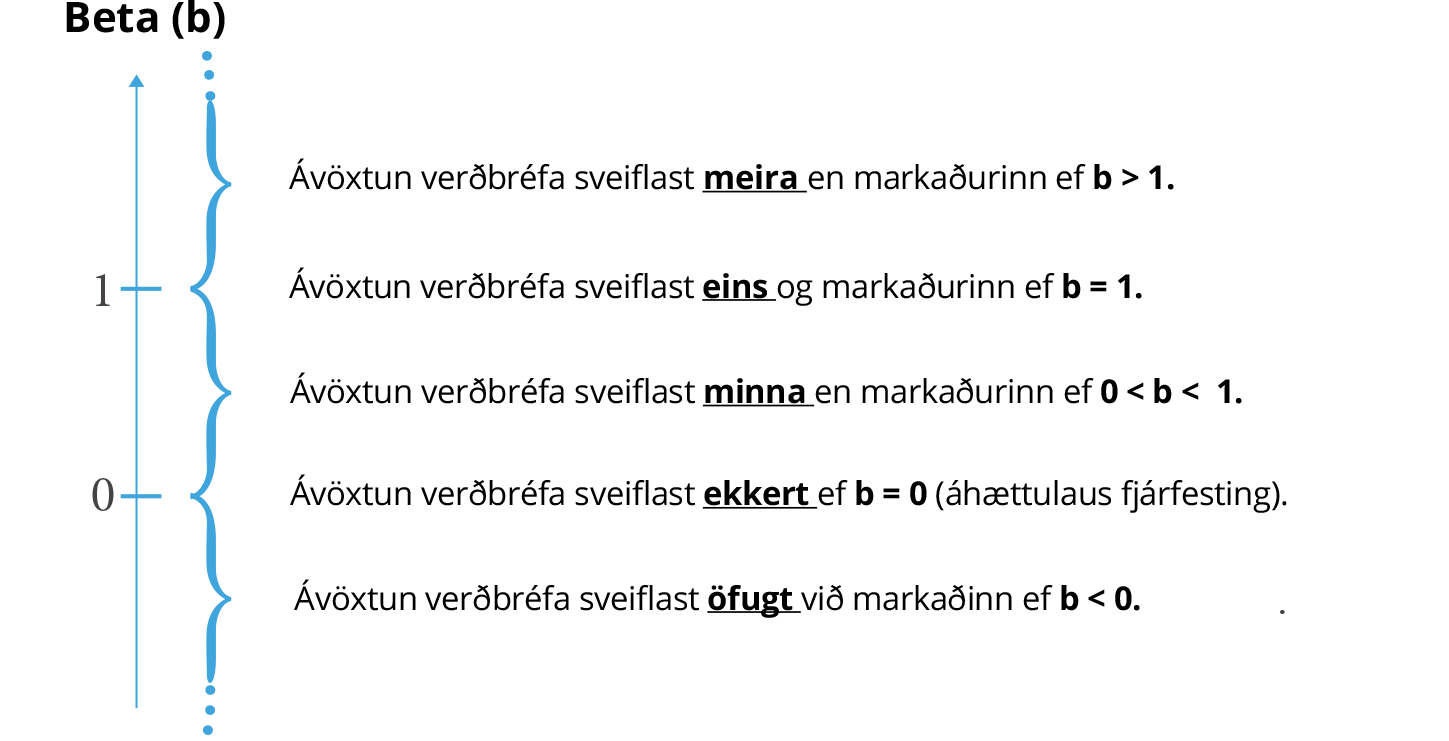
The beta of the market portfolio, which holds every security in the market, is always 1, while the beta of an individual security can be found by simple regression analysis. Beta is defined as the slope coefficient of that regression.
- bi = beta of security i
- σi = standard deviation of the return on security i
- σM = standard deviation of the return on the market portfolio
- ρiM = correlation between the return on security i and the return on the market portfolio
The relationship between risk and return
The best known and most widely used model for describing the relationship between risk and return is the capital asset pricing model (CAPM), which sets out the theoretical relationship between market risk, measured by beta, and required return.
- ri = required return on security i
- rM = required return on the market portfolio
- rRF = risk-free rate of return on treasury bills
- RPM = rM - rRF = the market risk premium
- bi = beta of security i
- (rM - rRF) · bi = risk premium on security i
Example 4-1
The rate on treasury bills is 6% and the market risk premium is 5%. A share has a beta of 0.5. What is the required return on the share?
From equation 4–2 one can draw the security market line (SML), which describes the required return on security i as a function of the security's beta:
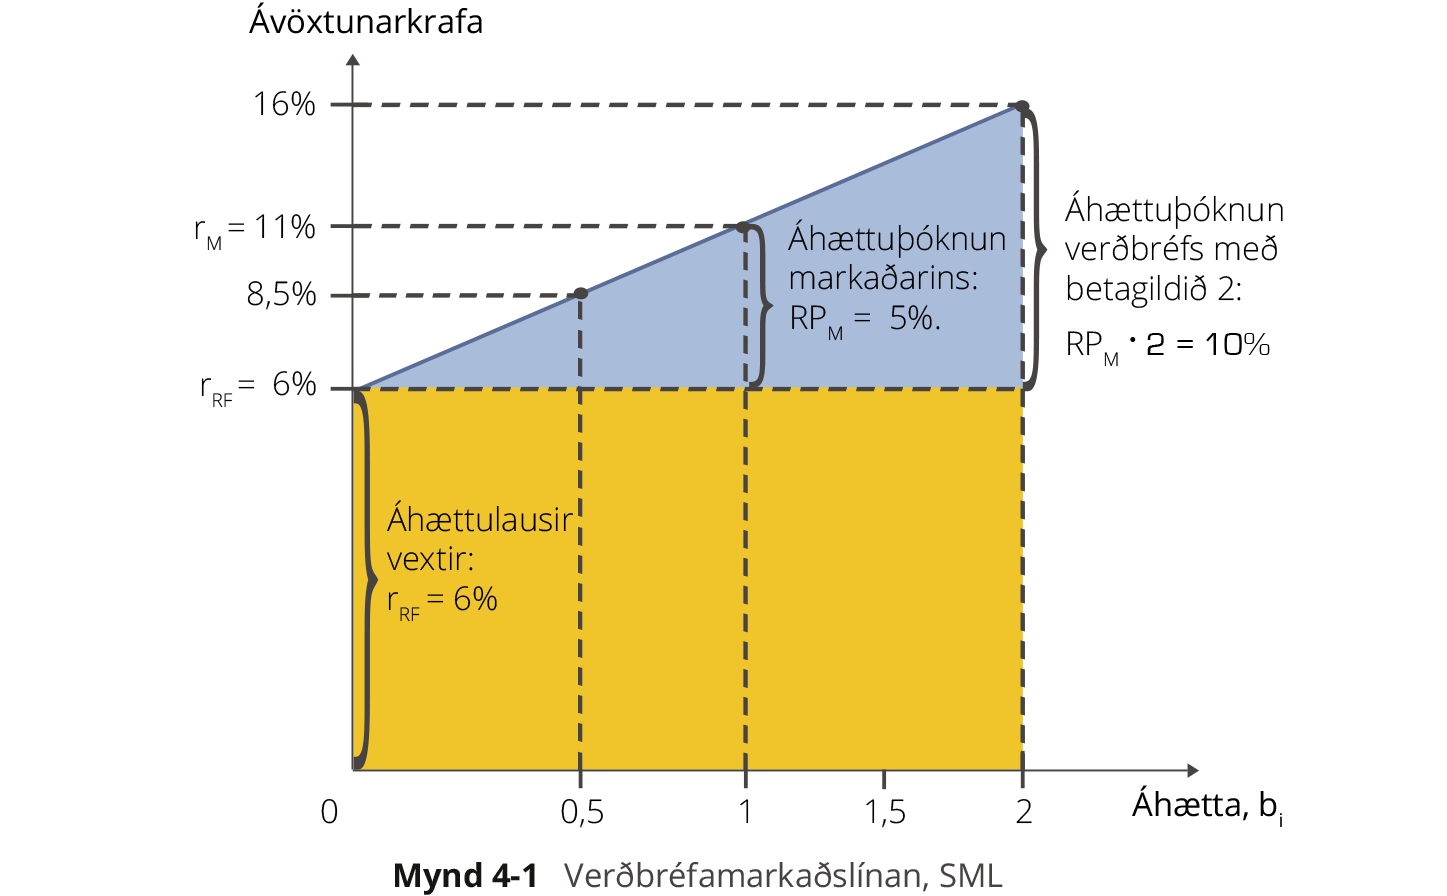
In figure 4–1 the rate on treasury bills is 6% and the market risk premium is 5%, so the required return on the market portfolio is 11%. As in the example above, the required return on the share is 8.5% when beta is 0.5. It can also be seen that the risk premium on a share with a beta of 2 would be 10%, giving a required return of 16%.
Efficient portfolios
A portfolio is said to be efficient if it is composed such that return cannot be increased without also increasing risk, and risk cannot be reduced without also reducing return.
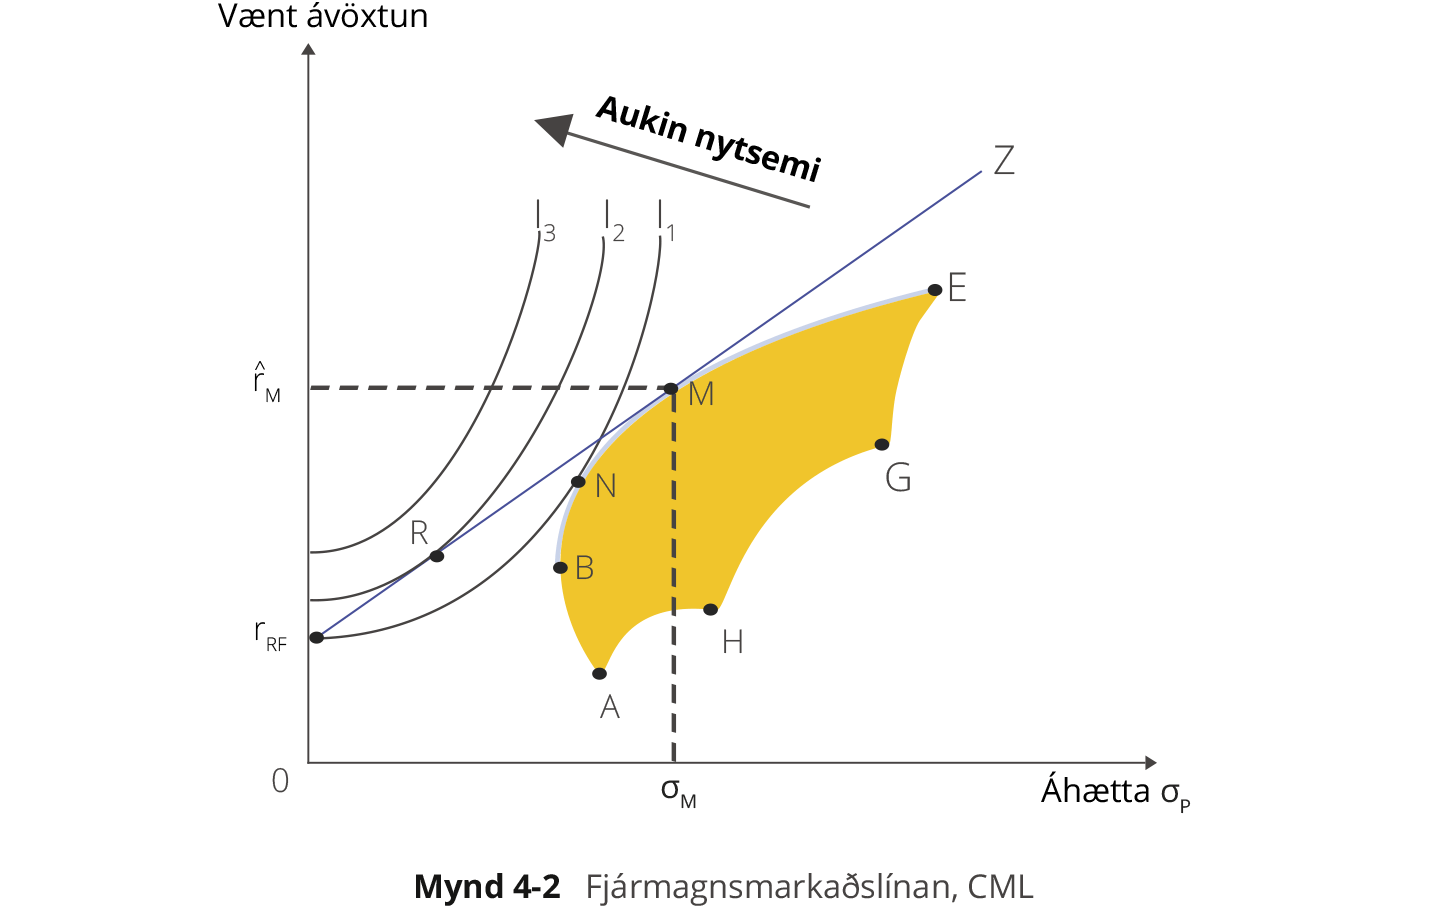
The yellow area in figure 4–2 shows the whole feasible set for securities A, H, G and E. The curve BNME is the efficient frontier, on which every efficient portfolio of those four securities lies. All combinations of risk and return that give an investor with a given risk tolerance the same utility can be described by the indifference curve In. If only those four securities were available, the investor would maximise utility by holding portfolio N, known as their optimal portfolio. If the same investor could also buy risk-free treasury bills, which sit at point rRF, they could increase utility further by buying portfolio R, a blend of portfolio M and treasury bills, moving from indifference curve I1 to I2.
The line rRFMZ is called the capital market line (CML), and it always lies above the efficient frontier except at the tangency point M. It is therefore most efficient for every investor to hold portfolio M and to buy or sell treasury bills according to how much risk they can bear. The capital market line can be described by the following equation:
- rp = expected return on portfolio p
- rM = expected return on the market portfolio
- rRF = risk-free rate of return on treasury bills
- σp = standard deviation of the return on portfolio p
- σM = standard deviation of the return on the market portfolio
Fama-French three-factor model
The CAPM described above uses only one variable, beta, to measure the market risk of a security. The model of Eugene Fama and Kenneth French uses three: alongside the market risk premium, it also draws on the company's market capitalisation and its book-to-market ratio (see part 7 on financial ratios).
- ri = required return on security i
- rRF = risk-free rate of return on treasury bills
- ai = alpha of security i
- rM = required return on the market portfolio
- rSMB = return on small-cap companies in excess of large-cap companies
- rHML = return on companies with a high book-to-market ratio in excess of those with a low one
- ci and di = coefficients found by simple regression analysis
Other pricing models
The economist Steven Ross at MIT developed a model called Arbitrage Pricing Theory, which uses as many variables to measure risk as the situation requires. Work in behavioural finance takes a different route, pricing securities from psychological analysis of the irrational but predictable ways investors behave in various circumstances.
Bonds
Bonds are the most important class of security anywhere in the world: a country's market interest rates are shaped by trading in them, according to the laws of supply and demand. Bonds, like other securities, are first sold on the primary market, and because they are transferable they are bought and sold on the secondary market once issued.
Types of bond
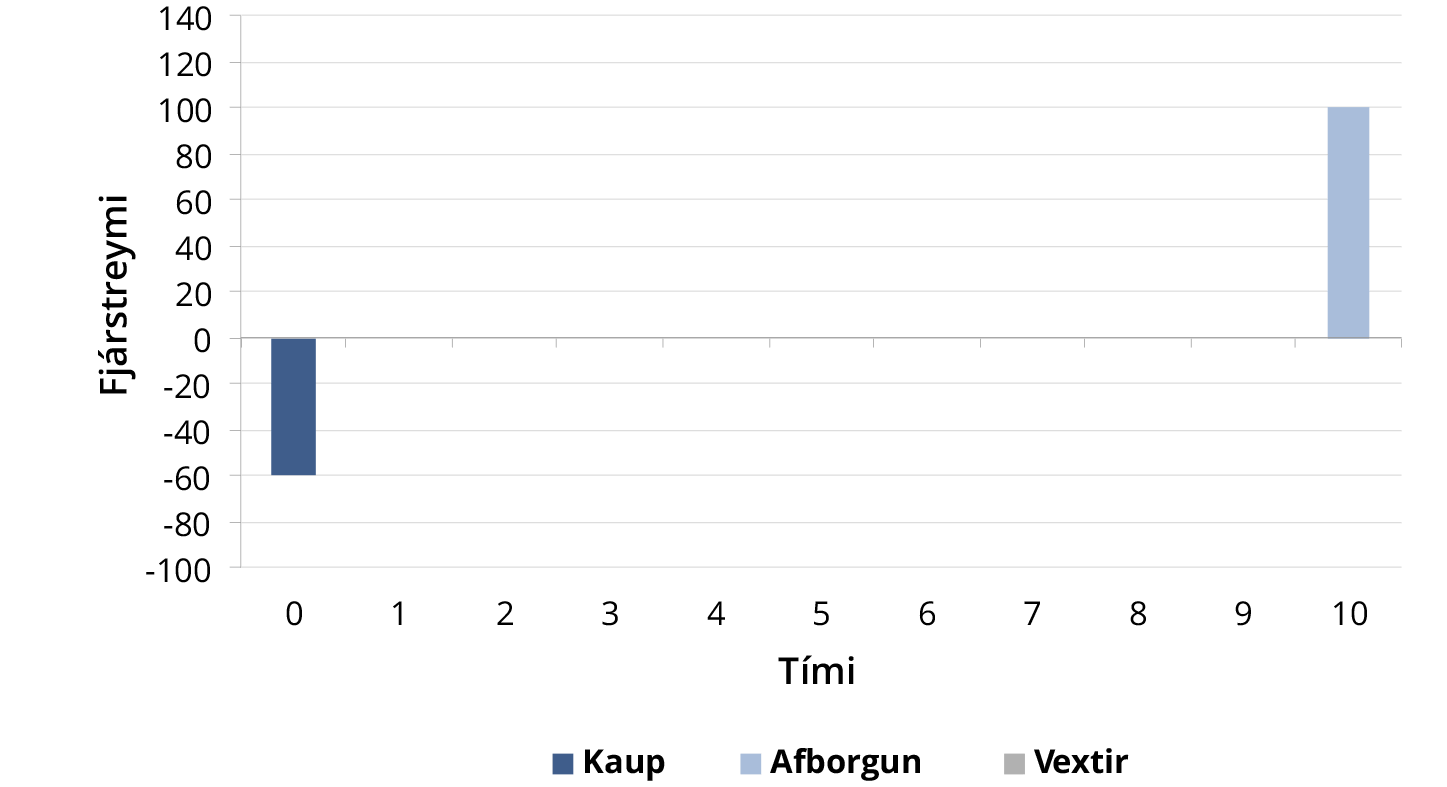
Zero-coupon bond
Carries no nominal interest. Repaid in a single payment of principal at the end of the term.
Example: A 10-year zero-coupon bond sold at a price of 60.
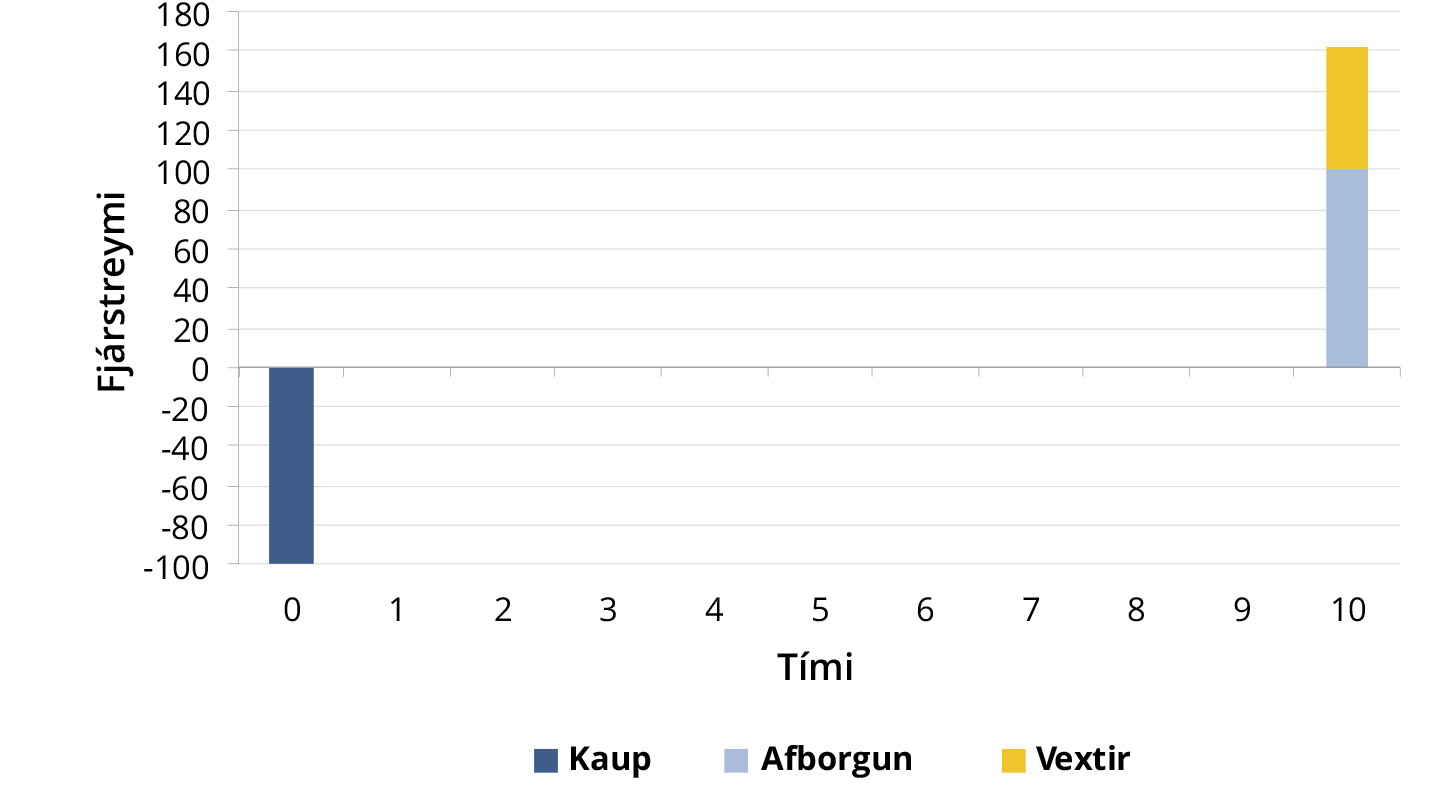
Bullet bond
Carries nominal interest that is added to the principal at regular intervals. Repaid in a single payment of the original principal, interest and compounded interest.
Example: A 10-year bullet bond with 5% nominal interest sold at par.
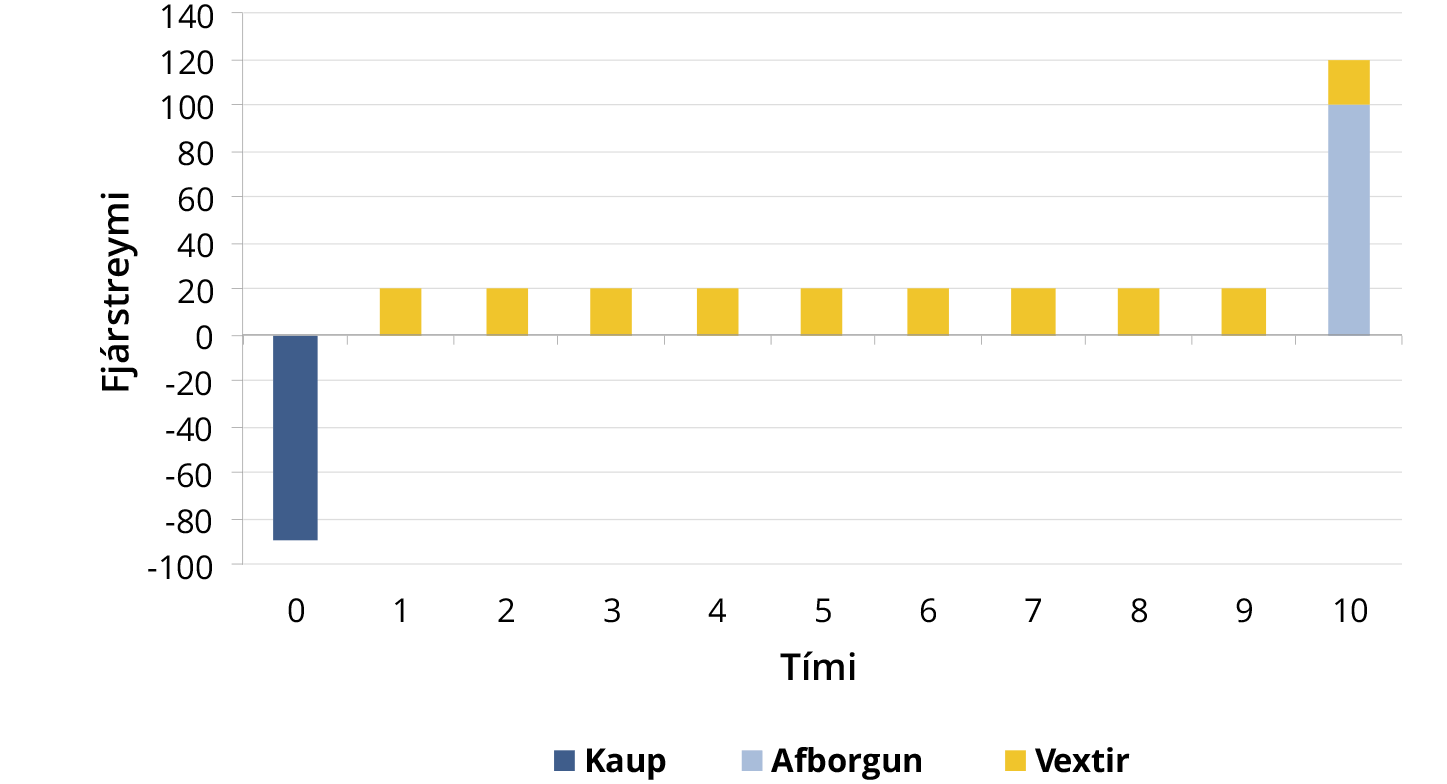
Coupon bond
Interest accrued in each period is paid at the end of that period. No principal is repaid until final maturity.
Example: A 10-year coupon bond with annual payments and 20% nominal interest sold at a price of 90.
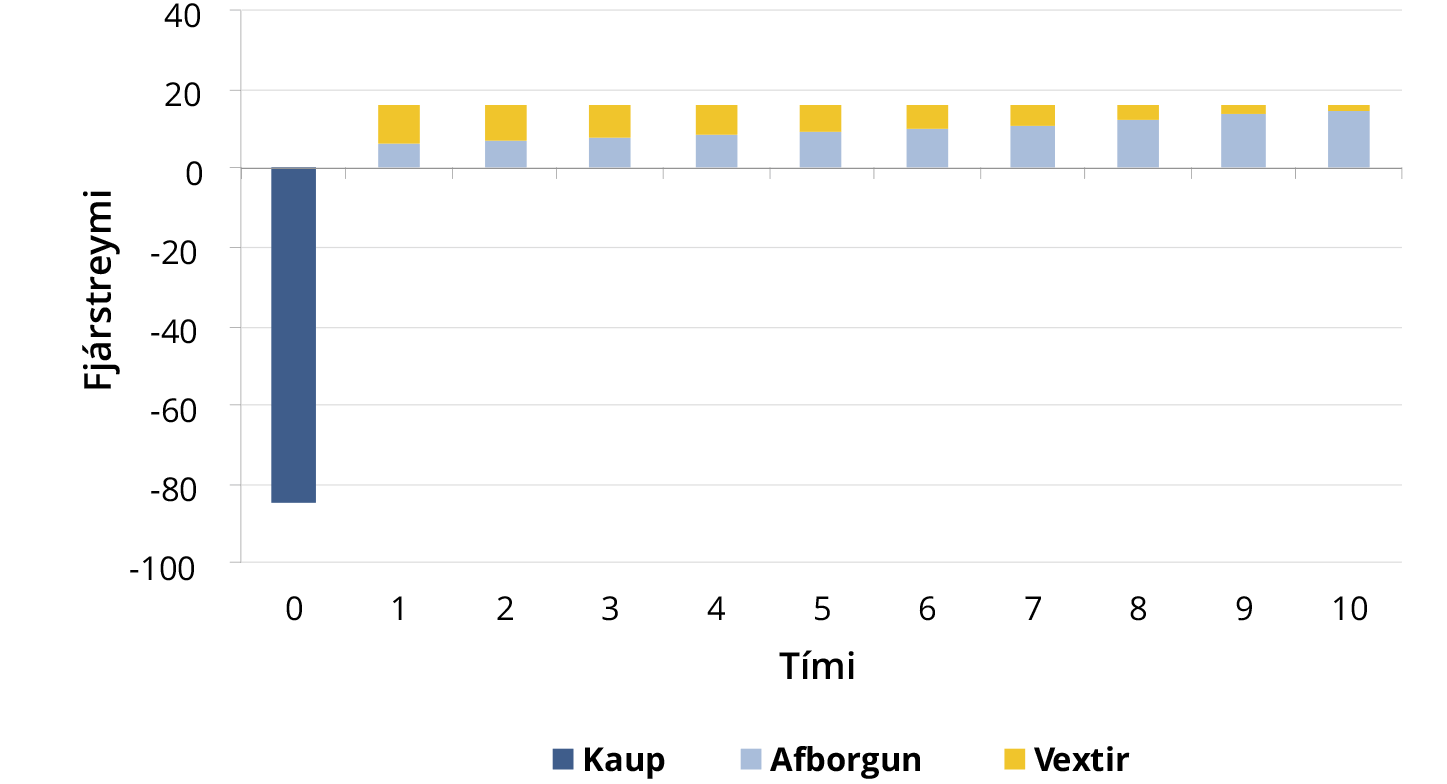
Annuity bond
Every payment on the bond is the same size. Payment = principal repayment + interest accrued in the period.
Example: A 10-year annuity bond with 10% nominal interest sold at a price of 85.
Fixed principal bond
Every repayment of principal is the same size. Interest accrued in each period is paid at the end of that period.
Example: A 10-year fixed principal bond with 12% nominal interest sold at a price of 80.
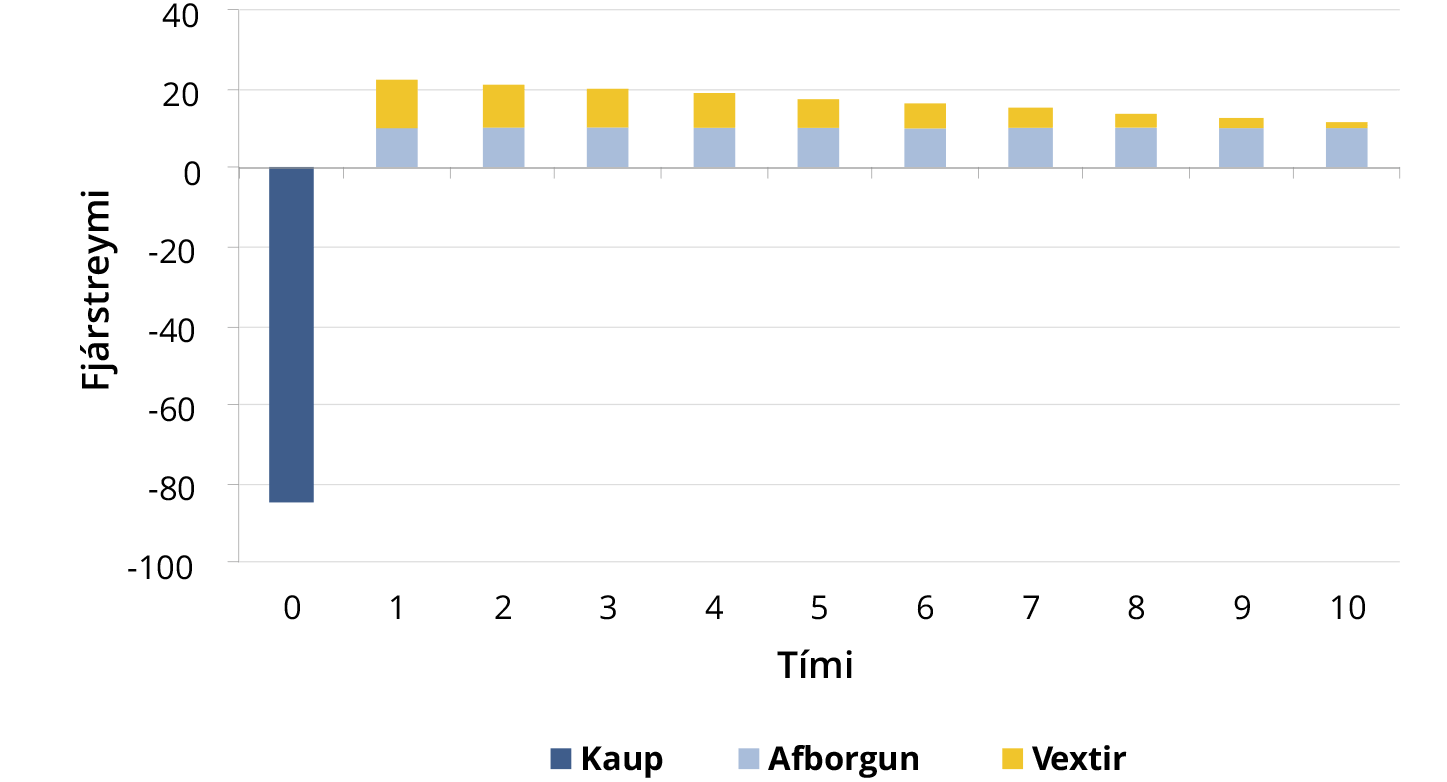
Perpetual bond
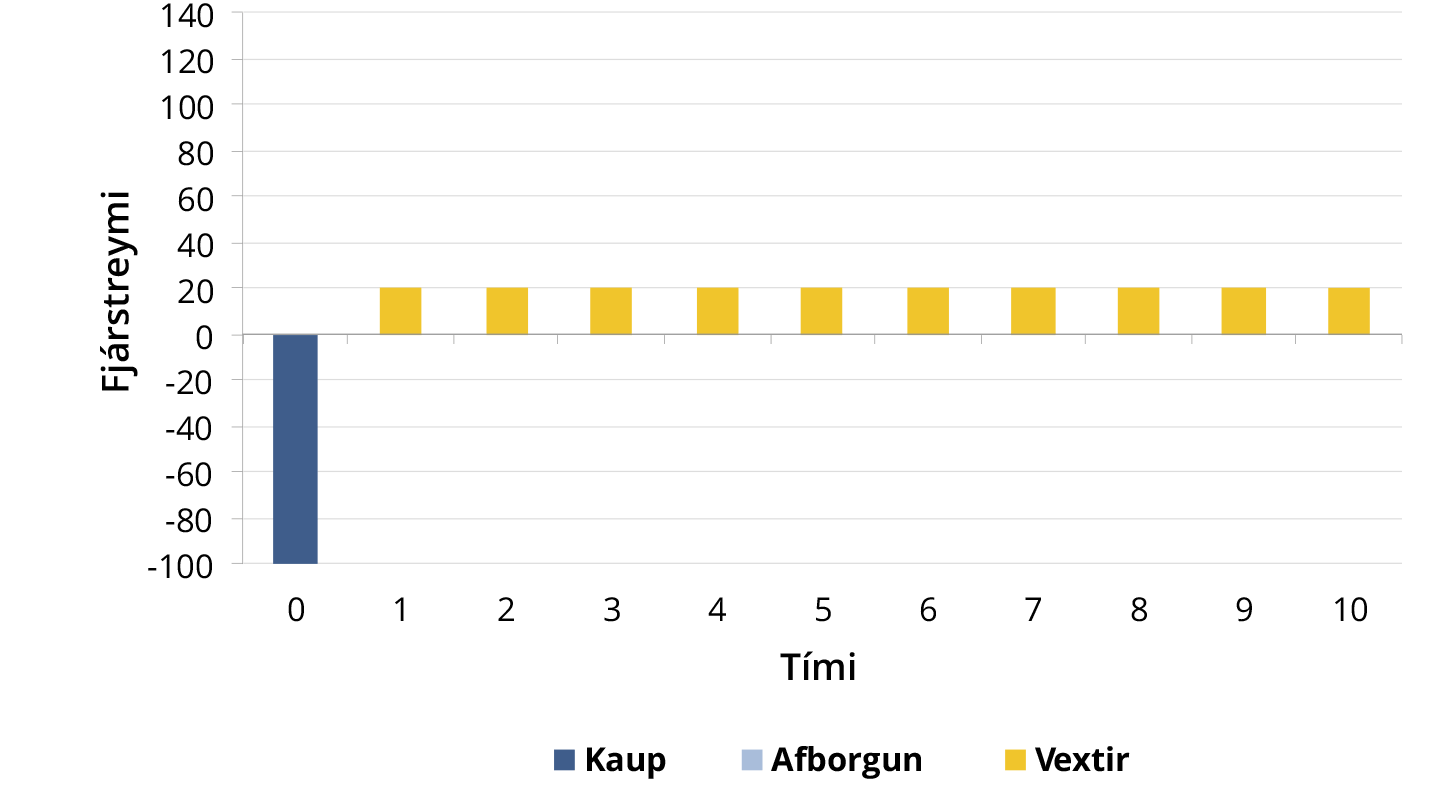
A perpetual bond carries fixed, regular interest payments forever. The principal is never repaid.
Example: A perpetual bond with 20% nominal interest sold at par.
Inflation-indexed bonds
If a bond is non-indexed, its stated rate is the nominal rate, so inflation does not affect its cash flows. If a bond is inflation-indexed, its stated rate is the real rate and both interest and principal payments are linked to the consumer price index, so inflation does affect its cash flows. Indexation ensures that future repayments hold the value they had on the day the loan was made or the saving began.
Bond valuation
The value of a bond is calculated in the same way as the value of a company in equation 1–1: by discounting the expected cash flows back to today at a given required return.
- VB = value of the bond
- INT = interest paid on the bond each period
- rd = required return on the bond
- M = face value of the bond
- n = number of periods
Example 5-1
Áhættusæknir ehf. issues a 15-year coupon bond with annual payments and 10% nominal interest. The face value is ISK 1,000,000 and the required return is 15%. What is the value of the bond?
In Microsoft ® Excel
- Example 5–1 can also be solved with the PV function in Excel:
- =PV(rate; nper; pmt; fv)
- =PV(15%; 15; -100000; -1000000)
- RATE is the required return, NPER the number of periods, PMT the interest payment and FV the face value of the bond.
When the required return on a bond is higher than its nominal rate, as with Áhættusæknir ehf., the bond sells at a discount. When the required return is lower, the bond sells at a premium.
Yield to maturity (YTM)
The return expected on a bond if it is held to final maturity.
Example 5-2
Áhættufælnir ehf. issues a 15-year coupon bond with annual payments and 10% nominal interest. The face value is ISK 1,000,000, but the bond sells for ISK 1,518,983. What is the yield to maturity?
Unlike the bonds of Áhættusæknir ehf., the required return on the bonds of Áhættufælnir ehf. is lower than the nominal rate, which is why their bonds sell at a premium.
Yield to call (YTC)
A bond with a call provision lets the issuer call the bond and repay the loan before final maturity. If rates fall, the issuer can refinance on better terms, but may in exchange have to pay the bondholder a call premium, most often one year's interest. The yield to call is found by solving for rd in the following equation:
- VB = value of the bond
- INT = interest paid on the bond each period
- rd = required return on the bond
- M = face value of the bond
- n = number of periods
- Call price = M + call premium
Example 5-3
Sveigjanlegir ehf. issues a 15-year coupon bond with annual payments and 10% nominal interest. The face value is ISK 1,000,000, but the bond sells for ISK 1,200,000. The bond is callable after 5 years and the call premium is 10% of principal.
a) What is the yield to maturity?b) What is the yield to call?
Current yield
Defined as the annual interest payment against the current price. Current yield is therefore a measure of a bond's cash flow, but it takes no account of capital gains yield. The total required return on a bond, rd, as it appears in equation 5-1, is therefore made up of both current yield and capital gains yield.
Credit rating agencies assess the default risk of issuers and assign ratings based on their analysis. The three largest such agencies are (1) Standard & Poor's, (2) Moody's Corporation, and (3) Fitch Group. Their ratings are defined as follows:
| Moody's | S&P | Fitch | Description | |||
|---|---|---|---|---|---|---|
| Long term | Short term | Long term | Short term | Long term | Short term | |
| Aaa | P-1 | AAA | A-1+ | AAA | F1+ | Prime |
| Aa1 | AA+ | AA+ | High grade | |||
| Aa2 | AA | AA | ||||
| Aa3 | AA- | AA- | ||||
| A1 | A+ | A-1 | A+ | F1 | Upper medium grade | |
| A2 | A | A | ||||
| A3 | P-2 | A- | A-2 | A | F2 | |
| Baa1 | BBB+ | BBB+ | Lower medium grade | |||
| Baa2 | P-3 | BBB | A-3 | BBB | F3 | |
| Baa3 | BBB- | BBB | ||||
| Ba1 | Not prime | BB+ | B | BB+ | B | Non-investment grade / speculative / junk |
| Ba2 | BB | BB | ||||
| Ba3 | BB- | BB- | ||||
| B1 | B+ | B+ | Highly speculative | |||
| B2 | B | B | ||||
| B3 | B- | |||||
| Caa1 | CCC+ | C | CCC | C | Substantial risks | |
| Caa2 | CCC | Extremely speculative | ||||
| Caa3 | CCC | In default with little prospect for recovery | ||||
| Ca | CC | |||||
| C | ||||||
| C | D | / | DDD | / | In default | |
| / | DD | |||||
| / | DD | |||||
The annual accounts
A company's balance sheet is often shown graphically as in figure 6–1, which sets out how assets = liabilities + equity, and how assets divide into current assets and fixed assets, and liabilities into current liabilities and long-term liabilities.
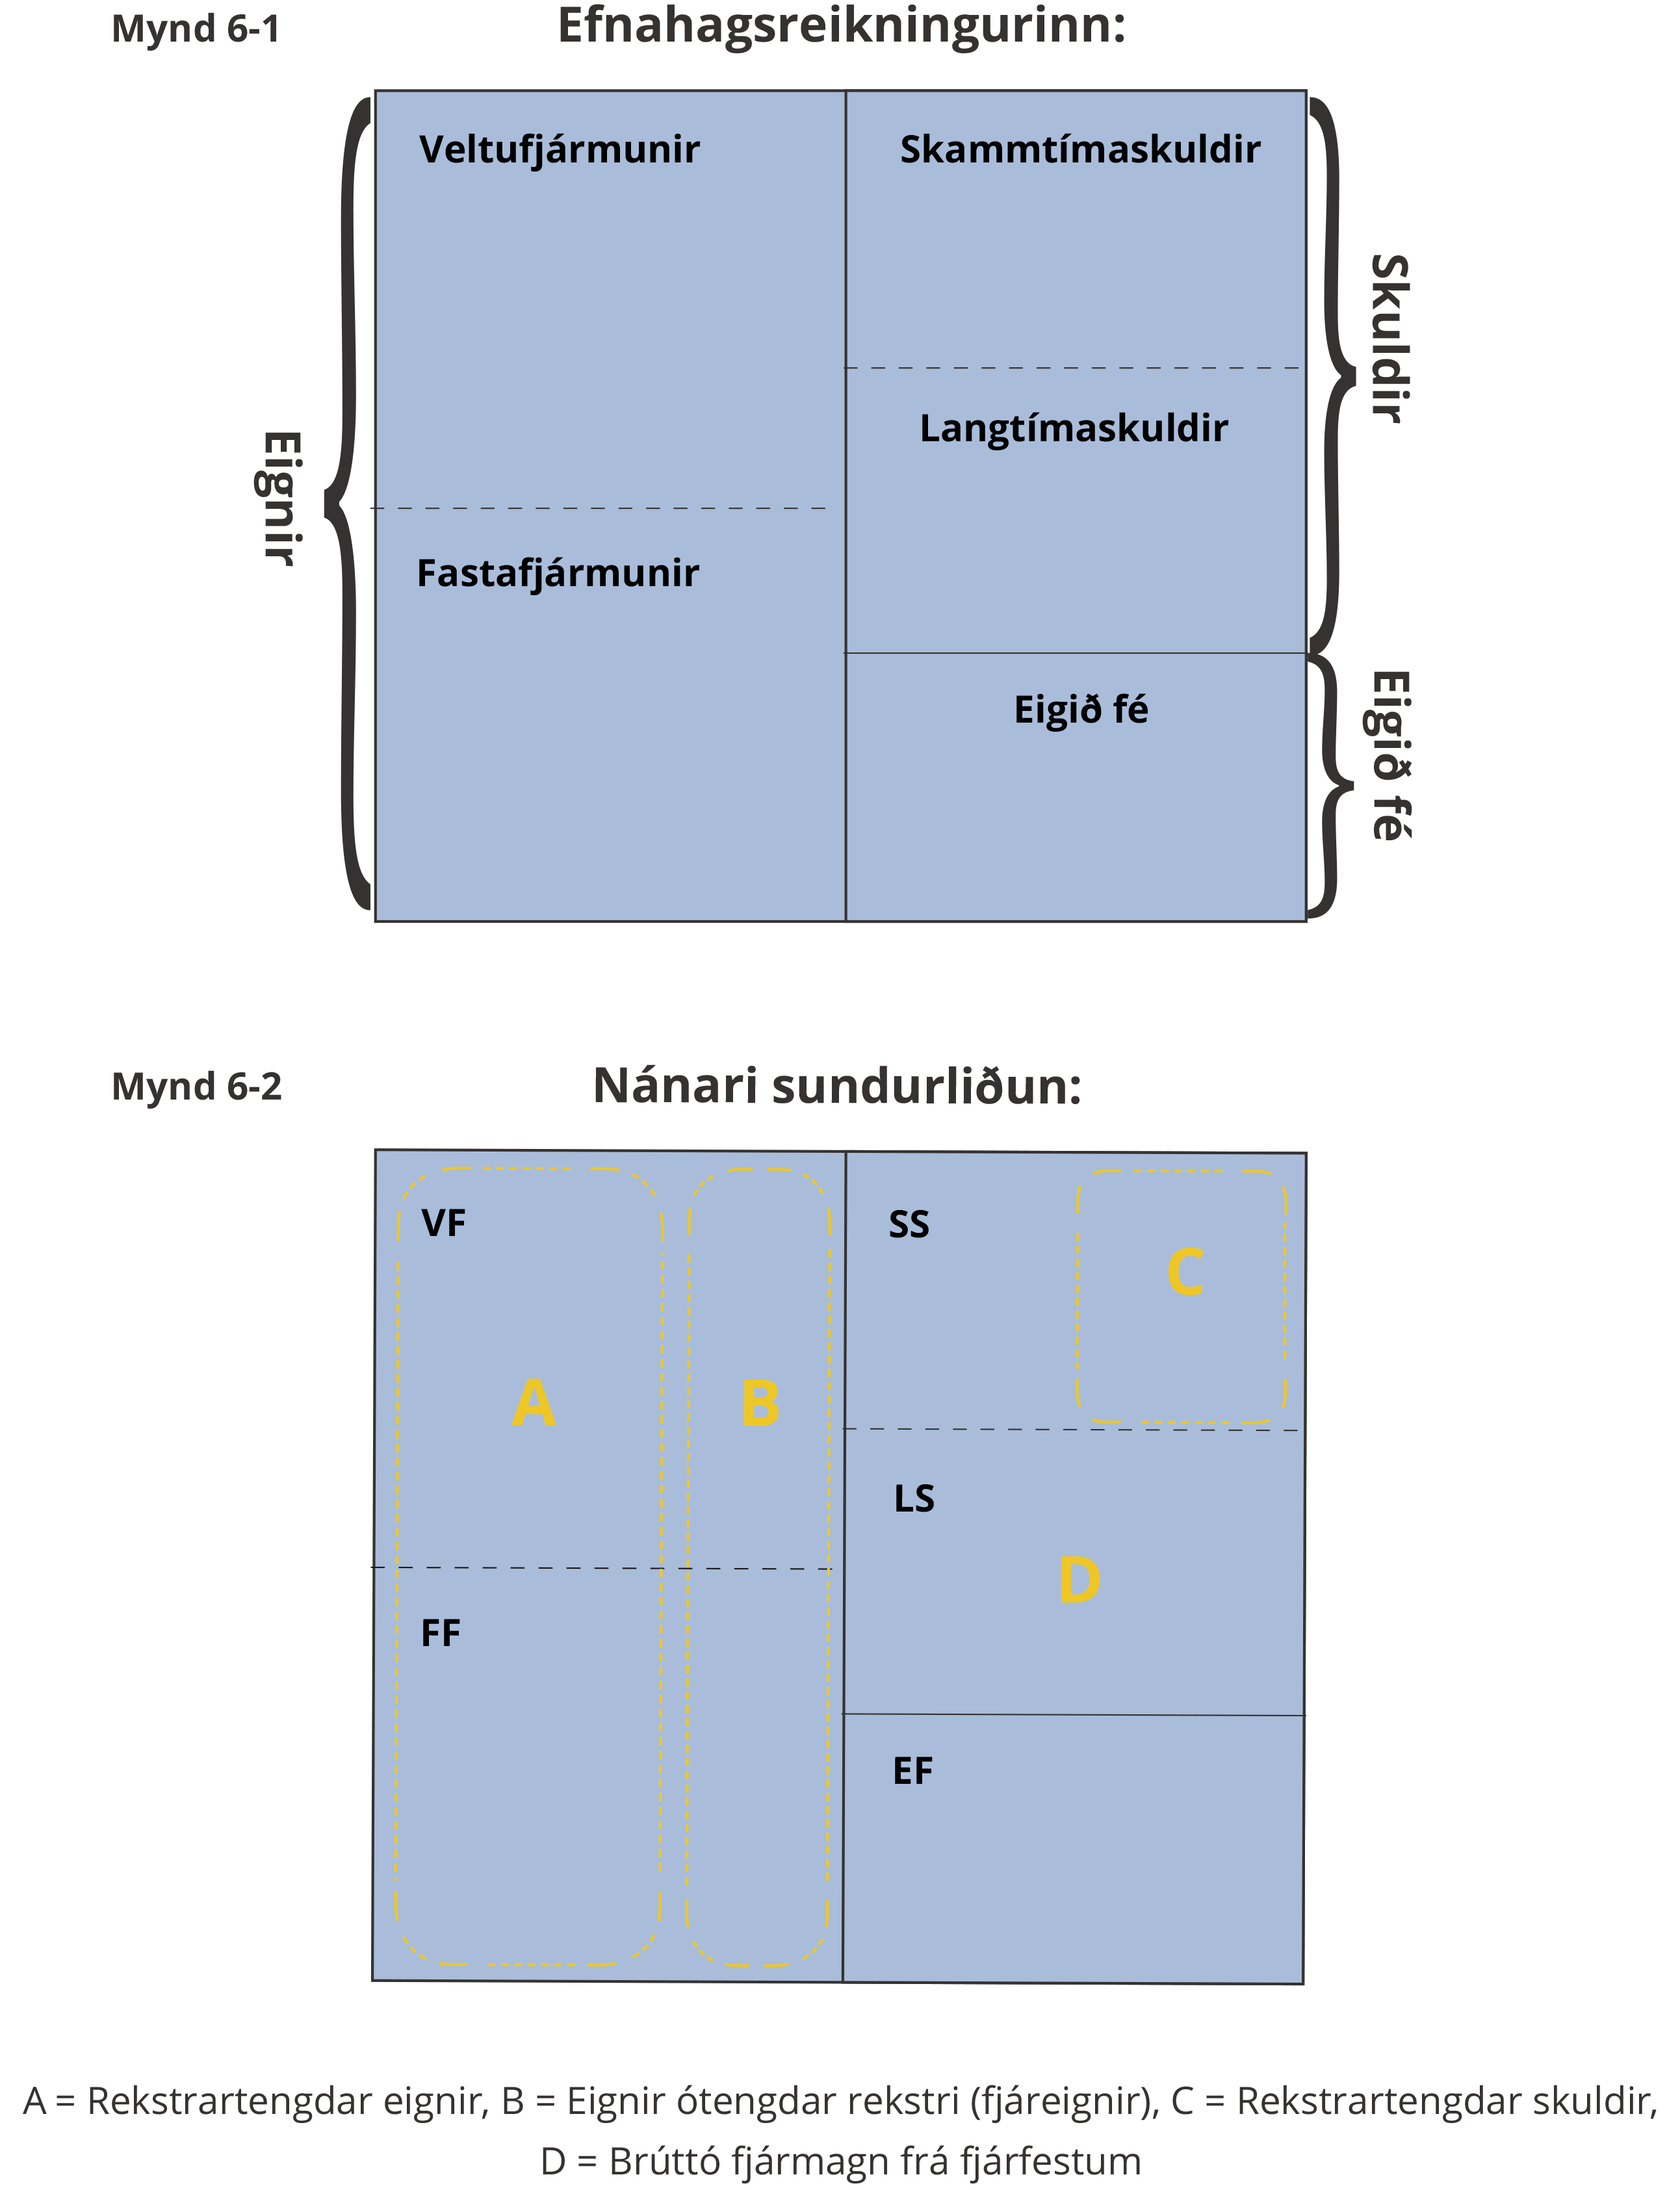
To find operating capital (OC), the balance sheet is split up as in figure 6–2, where A+B = C+D and therefore also A–C = D–B.
Net operating profit after taxes (NOPAT) is the profit a company would report if it had no debt and held no financial assets.
- EBIT = earnings before interest and taxes
The cash flow available to all investors after a company has invested enough in operating capital (OC) to sustain continuing operations is called free cash flow (FCF).
To see how well a company uses its operating capital to generate profit, look at return on invested capital (ROIC).
One of the most common measures in value-based management is economic value added (EVA), which measures the effect of investment, cost of capital and operations on the value of a company.
The weighted average cost of capital (WACC) is covered in more detail in part 8, but equation 6–6 shows that a company only increases its value if ROIC > WACC.
Financial ratios
Financial ratios are grouped here into five categories: (1) profitability, (2) liquidity, or a company's ability to pay its debts, (3) coverage ratios, or a company's financial strength and room to grow, (4) activity ratios, and (5) market value.
Profitability ratios
Liquidity ratios
- Quick assets = Current assets - Inventory
Coverage ratios
Activity ratios
Market value ratios
Cost of capital
The weighted average cost of capital (WACC) is the average cost to a company of raising the capital it uses to fund its operations.
- wd, wps and wce = weights for debt (d), preferred stock (ps) and common equity (ce), so that wd + wps + wce = 1
- rd = required return on debt
- T = tax rate
- rps = required return on preferred stock
- rs = required return on common equity
There are various ways to calculate rs; two are given here. The first is to use the capital asset pricing model (CAPM) and apply the security market line (SML) equation (see equation 4–2):
- rs = required return on share s
- rM = required return on the market portfolio
- rRF = risk-free rate of return on treasury bills
- RPM = rM - rRF = the market risk premium
- bs = beta of share s
- (rM - rRF · bs = risk premium on share s
The second is to use the Gordon growth model and apply the following equation:
- D0 = the most recent dividend
- D1 = expected dividend one year from now
- P0 = price of share s today
- g = expected dividend growth
Example 8-1
Shares in Stórfyrirtæki hf. are valued at ISK 30 per share, and the company paid a dividend of ISK 3 per share last year. Expected dividend growth is 5%.
What is the required return on shares in Stórfyrirtæki hf.?
Equity can be raised by retaining earnings from previous years or by issuing new shares on the stock market. The latter carries a flotation cost (F), which must be taken into account when calculating rs.
- re = required return on external equity (e)
- D1 = expected dividend one year from now
- P0 = price of share s today
- F = flotation cost
- g = expected dividend growth
Company valuation
As figure 6–2 shows, a company's assets split into A, operating assets and B, non-operating assets. The value of operations (Vop) is the sum of all free cash flow (FCF) from the operating assets, discounted at the weighted average cost of capital (WACC).
- D0 = the most recent dividend
- D1 = expected dividend one year from now
- P0 = price of share s today
- g = expected dividend growth
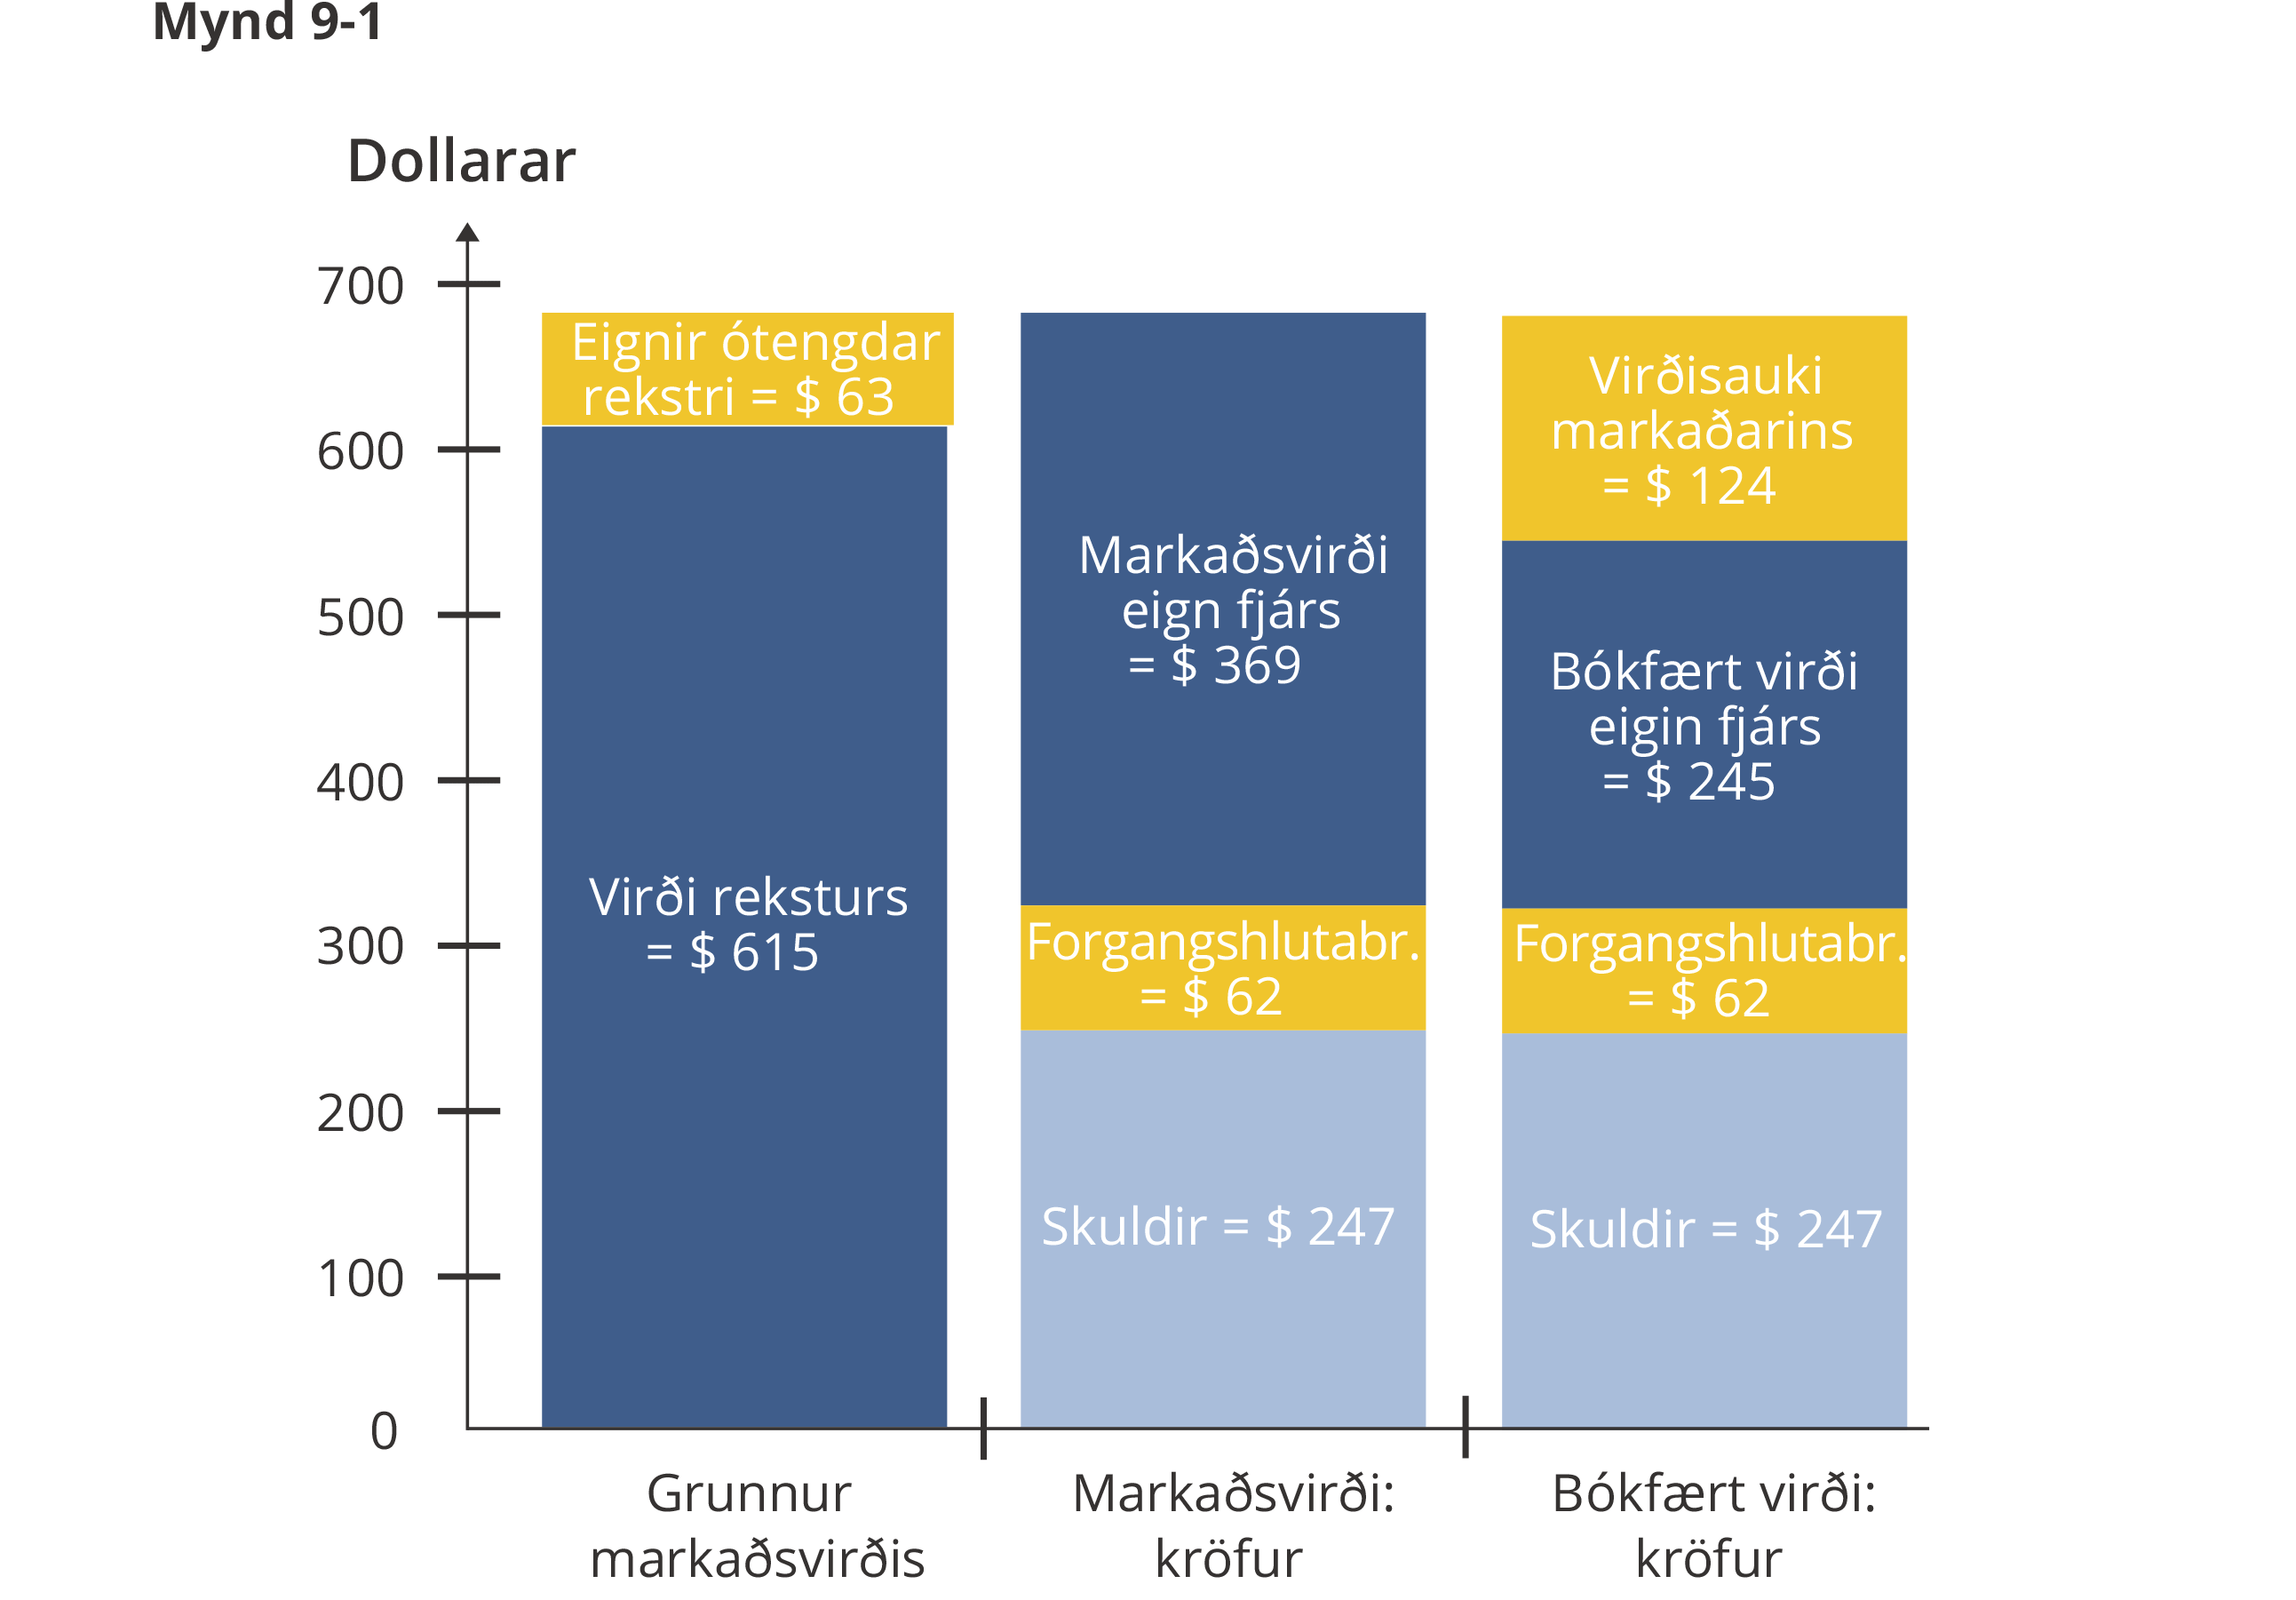
The total value of the company is shown in figure 9–1 and is made up of the value of operations, Vop, plus the value of non-operating assets.
The market value of equity is then the total value of the company less the value of debt and preferred stock.
The book value of equity can be read from the company's annual accounts, but it can also be described like this: